# Add reference line in a bode plot
Sometimes, adding a reference line can explain a lot in a plot.
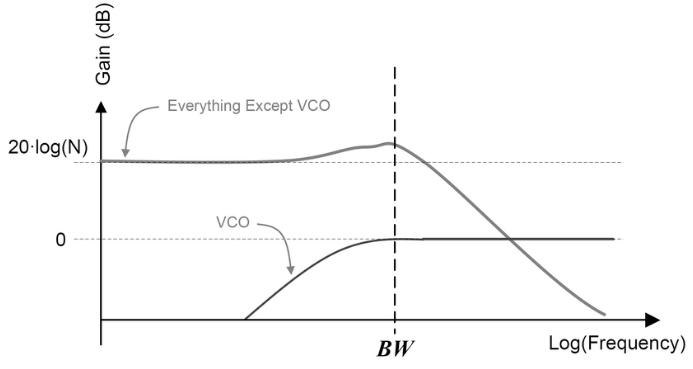
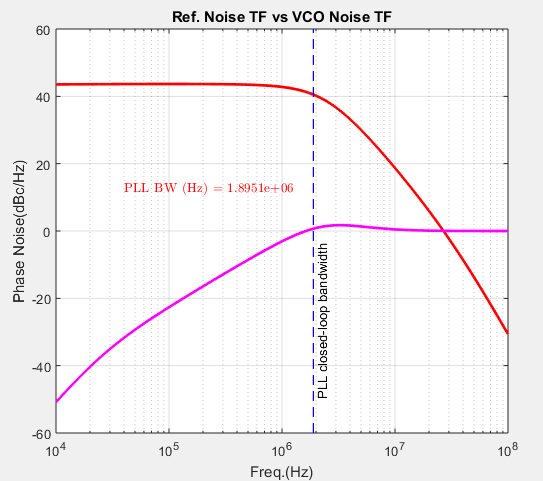
For PLL noise transfer functions, the reference noise transfer function has a low pass characteristic. The VCO noise transfer function has a high pass characteristic.
The PLL bandwidth splits the noise plot into two regions:
- phase noise of VCO dominates the high frequencies because its noise transfer function have no effect in this region
- phase noise of references and phase detector dominates the low frequency region

> noise transfer functions of the reference and VCO
Therefore, it is useful to show the PLL bandwidth in the plot.
New version Matlab provides a 'xline' function, vertical line with constant x-value, to plot a line in a plot.

If you don't have the new version of Matlab, you can use another m function ([Link](https://wwem.lanzouq.com/iSonk1hpecmh)) to add a reference line.
Example code is shown below:

 > noise transfer functions of the reference and VCO
Therefore, it is useful to show the PLL bandwidth in the plot.
New version Matlab provides a 'xline' function, vertical line with constant x-value, to plot a line in a plot.
 If you don't have the new version of Matlab, you can use another m function ([Link](https://wwem.lanzouq.com/iSonk1hpecmh)) to add a reference line.
Example code is shown below:

No comments:
Post a Comment