---
# Summary
- installation iverilog and gtkwave
- run the digital demo block to check the tool flow
- compile the code:
- `iverilog -o DUT.out DUT.v tb_DUT.v`
- run the executable file
- `vvp DUT.out`
- plot dumped *.vcd* data file (don't forget the put dumped code in testbench)
- `gtkwave DUT.vcd`
- different OS can use different ways to make the flow easier. Please send an email to ask for codes working on Windows or Linux.
- Window OS: `.bat` file
- Linux OS: `Makefile`
---
```
initial
begin
$ dumpfile("DUT.vcd"); //The name of the generated vcd file
$ dumpvars(0, tb_DUT ); //The name of the tb module
end
```
---
# Introduction
[Icarus Verilog](https://github.com/steveicarus/iverilog)) is an open-source Verilog simulator with _some_ SystemVerilog support. I really like to use it for quick digital circuit design and simulation. Icarus Verilog compiles the Verilog source into a file that is executed by its simulator `vvp`.
[GTKWave](http://gtkwave.sourceforge.net/) is a open-source waveform viewer/plot tool, which is excellent for plotting digital signals in the simulation. It supports to read and view LXT, LXT2, VZT, FST, and GHW files as well as standard Verilog VCD/EVCD files
Many fresh engineers might not be familiar with Iverilog and GTKWave. After using it for many years, I wish I know it when I was in college so I'd like to give a quick tutorial for all new engineer students who like to try open-source digital tool.
# Demo Example
Basic 4-b counter is written in verilog.
```
/**
* 4-bit counter
*/
module counter
(
input clk, // posedge clock
input clr, // synchronous clear
input en, // enable: active high to increment
output [3:0] cnt // counter value
);
reg [3:0] cnt_reg, cnt_next;
assign cnt = cnt_reg;
always @(*) begin
cnt_next = cnt_reg;
if (clr) begin
cnt_next = 4'd0;
end else if (en) begin
cnt_next = cnt_reg + 1;
end
end
always @(posedge clk) begin
cnt_reg <= cnt_next;
end
endmodule
```
The simple counter testbench
```
`timescale 1ns/100ps // 1 ns time unit, 100 ps resolution
module tb_counter;
reg clk;
always #5 clk = !clk;
reg clr, en;
wire [3:0] cnt;
counter counter_0
(
.clk(clk),
.clr(clr),
.en(en),
.cnt(cnt)
);
integer i;
initial begin
// create a VCD waveform dump called "tb_counter.vcd"
// dump variable changes in the testbench
// and all modules under it
$dumpfile("counter.vcd");
$dumpvars(0, tb_counter);
end
initial begin
$monitor("t=%-4d: cnt = %d", $time, cnt);
clk = 0; clr = 1; en = 0;
@(negedge clk);
clr = 0; en = 1;
for (i = 0; i < 64; i = i + 1) begin
@(negedge clk);
end
$finish();
end
endmodule
```
The function `$dumpfile()` and `$dumpvars()` are to output vcd file for plotting data.
# Simulation Flow
## compile and run
iverilog compiles the source modules to produce files for vvp.
```
iverilog -o tb_counter.out counter.v tb_counter.v
vvp counter.out
```
Makefile is used to speed up in Linux.
```
TOP = test_counter
SRC = counter.v
TEST_SRC= tb_counter.v
BIN = $(TOP).vvp
$(BIN): $(SRC) $(TEST_SRC)
iverilog -o $(BIN) -s $(TOP) $(SRC) $(TEST_SRC)
.PHONY: all clean test
all: $(BIN)
test: $(BIN)
vvp $(BIN)
clean:
rm -f *.vvp *.vcd
```
For better usage, I have an updated Makefile. Please send me an email to get a copy of it.
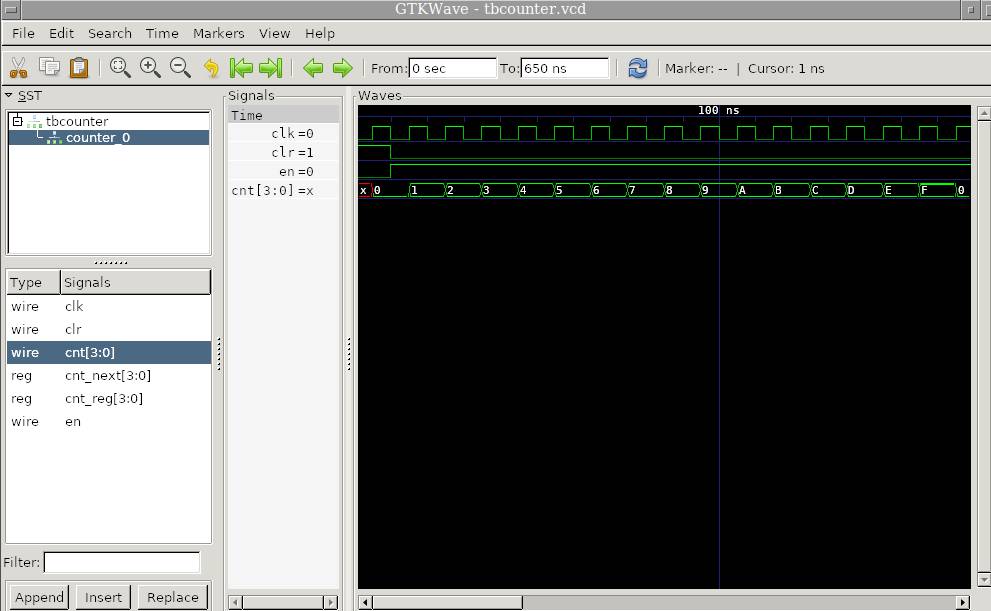
## Plot Data
GTKWave is to open vcd files and to plot signals.
```
gtkwave counter.vcd
```
# More about Iverilog
## parameter `-o`
set the name of compiling output file: `iveirlog test.v -o test.out`
## parameter `-y`
set the project folder or design folder: `iverilog -y $DIR/demo demo_tb.v`
## parameter `-tvhdl`
convert verilog to VHDL: `iverilog -tvhdl -o output_file.vhd in_file.vhd`
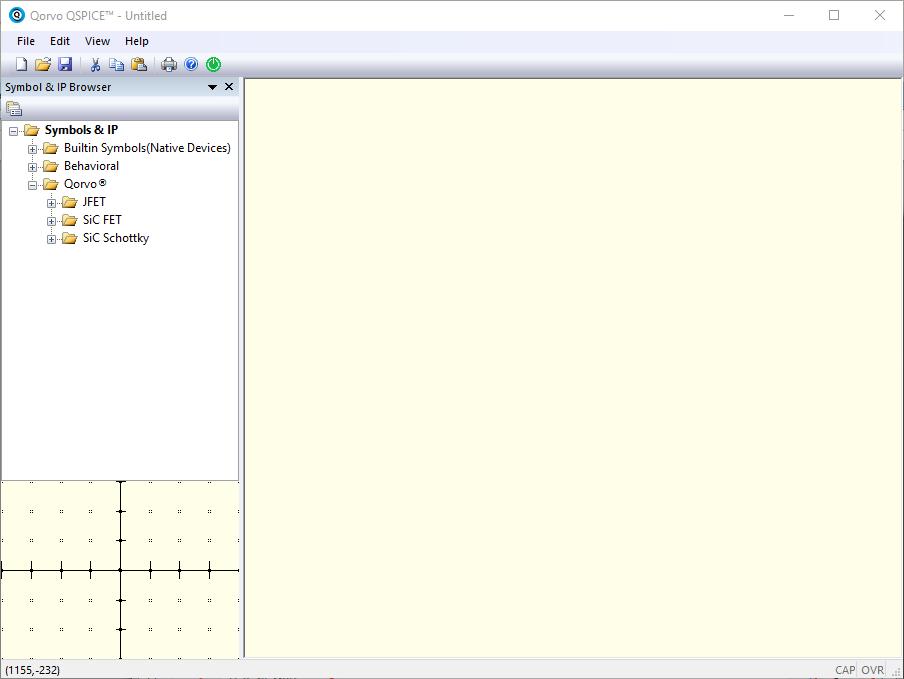 ---
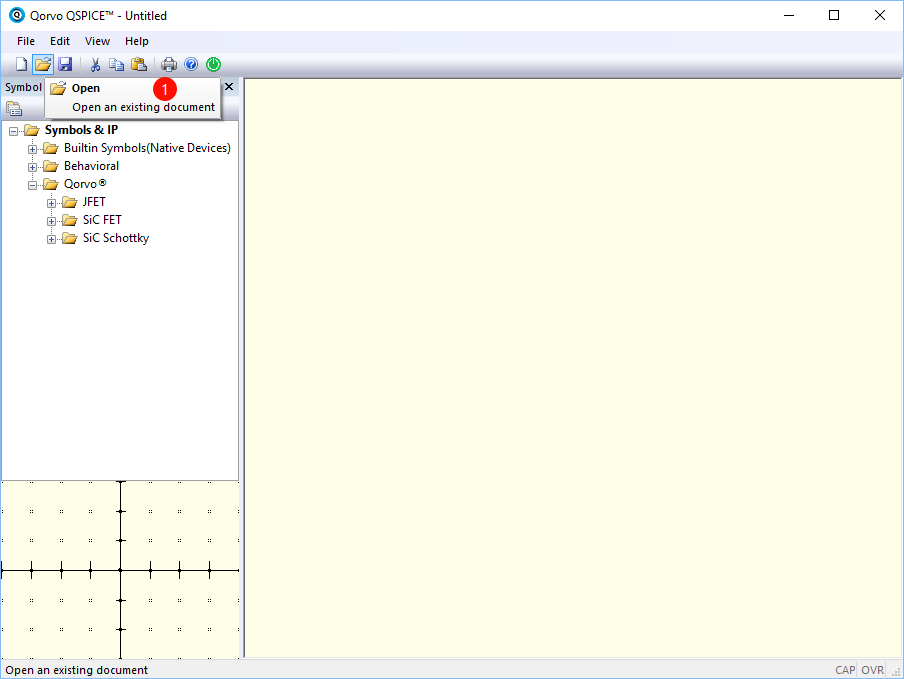
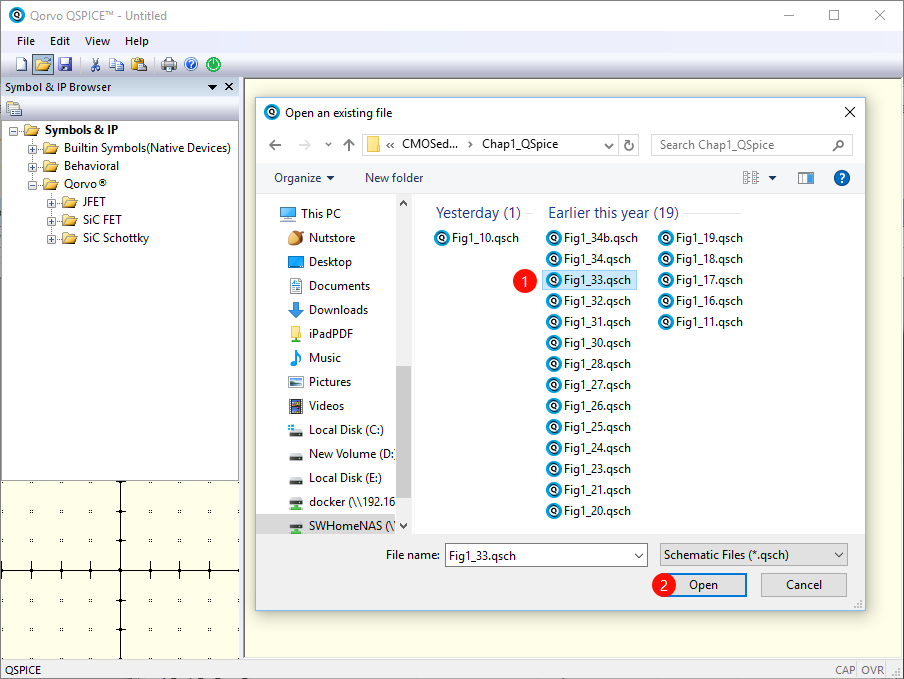
> Open a new QSPICE schematic
---
> Open a new QSPICE schematic
 ---
> Select the textbook circuit model
---
> Select the textbook circuit model
 ---
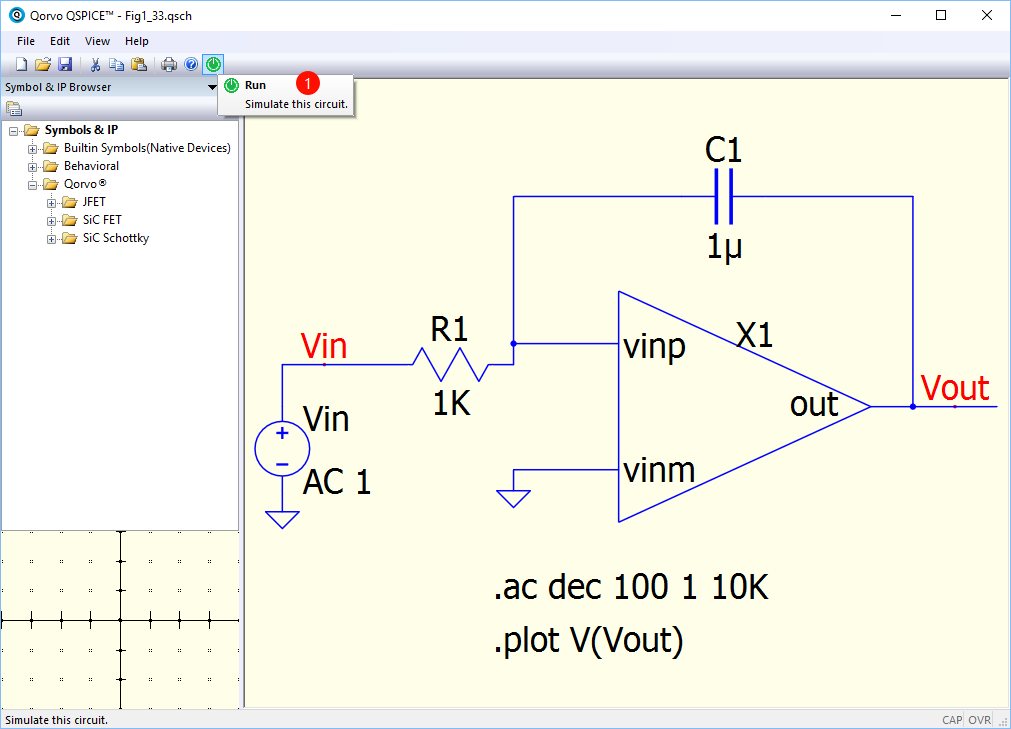
> Run the simulation
---
> Run the simulation
 ---
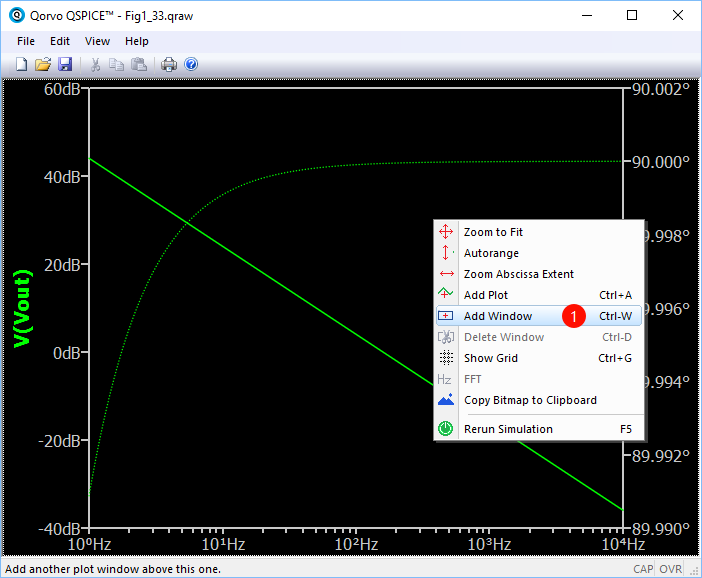
> Plot simulation results and Create a new window panel in the plot (Right click the current plot panel)
---
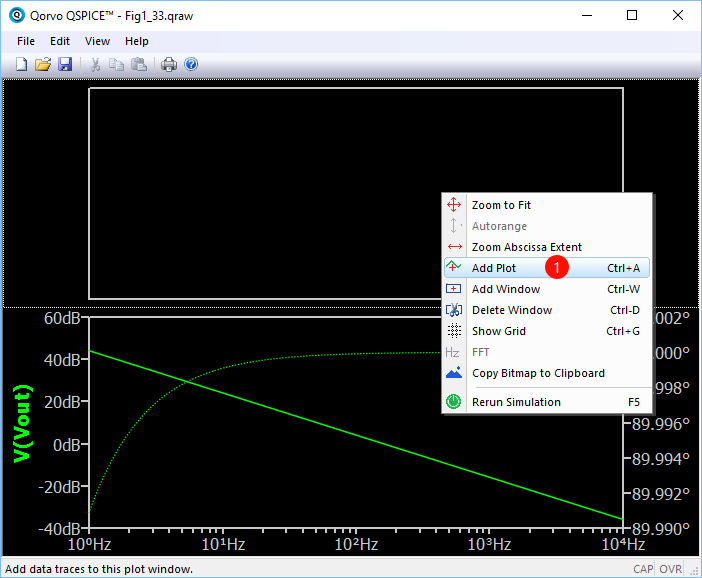
> Add plot in the new panel (Right click the new panel)
---
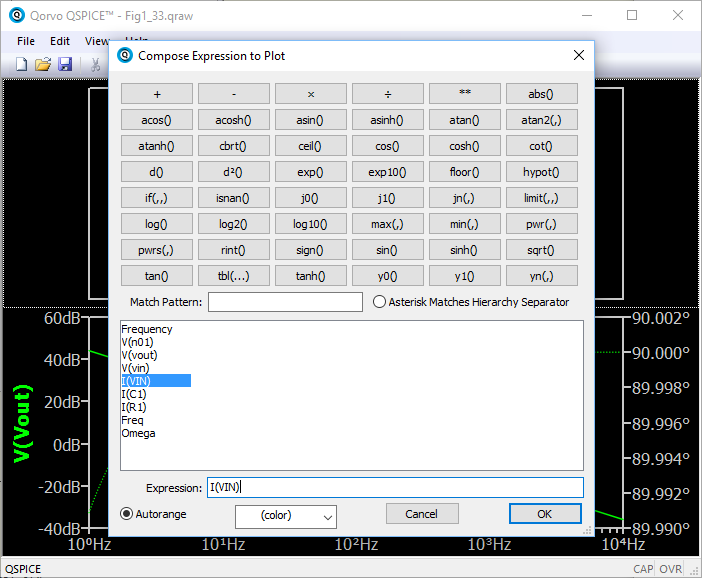
> Select another signal to plot in new panel and function table listed in the 'New Expression window'
---
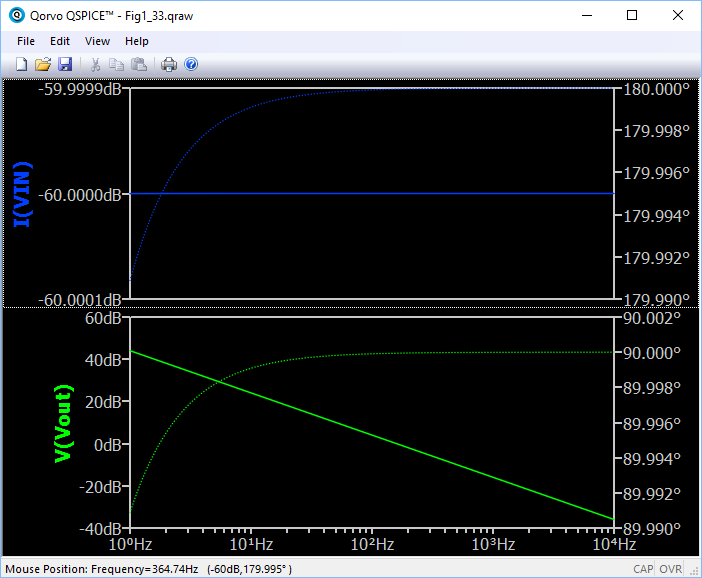
> Final Simulation Result Plot
---
> Plot simulation results and Create a new window panel in the plot (Right click the current plot panel)

---
> Add plot in the new panel (Right click the new panel)

---
> Select another signal to plot in new panel and function table listed in the 'New Expression window'

---
> Final Simulation Result Plot

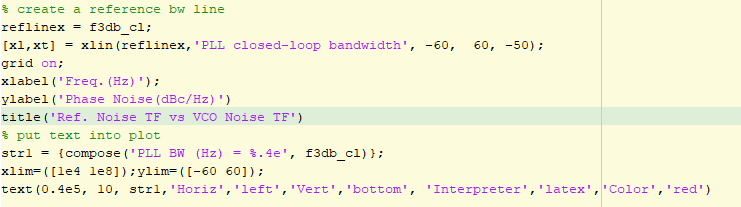
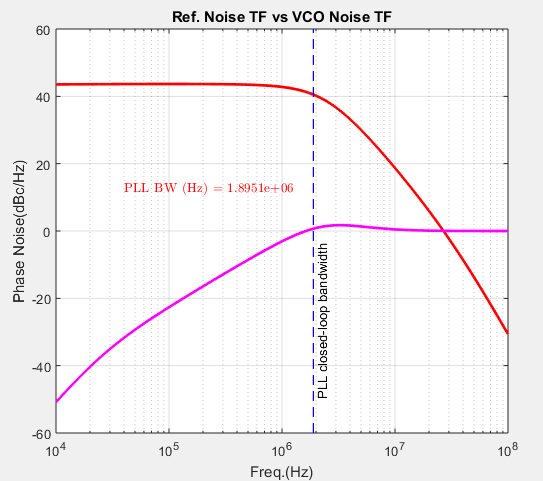
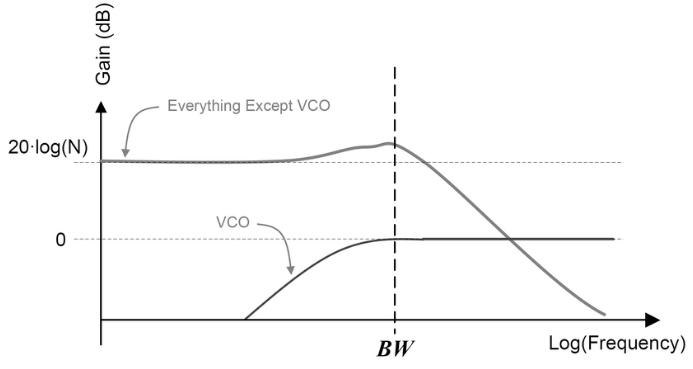 > noise transfer functions of the reference and VCO
Therefore, it is useful to show the PLL bandwidth in the plot.
New version Matlab provides a 'xline' function, vertical line with constant x-value, to plot a line in a plot.
> noise transfer functions of the reference and VCO
Therefore, it is useful to show the PLL bandwidth in the plot.
New version Matlab provides a 'xline' function, vertical line with constant x-value, to plot a line in a plot.
 If you don't have the new version of Matlab, you can use another m function ([Link](https://wwem.lanzouq.com/iSonk1hpecmh)) to add a reference line.
Example code is shown below:
If you don't have the new version of Matlab, you can use another m function ([Link](https://wwem.lanzouq.com/iSonk1hpecmh)) to add a reference line.
Example code is shown below: