# Start to use Qspice textbook circuit models from ASICedu.com
- Make sure to install QSPICE and unzip the Qspice_CMOSedu.zip (
link)
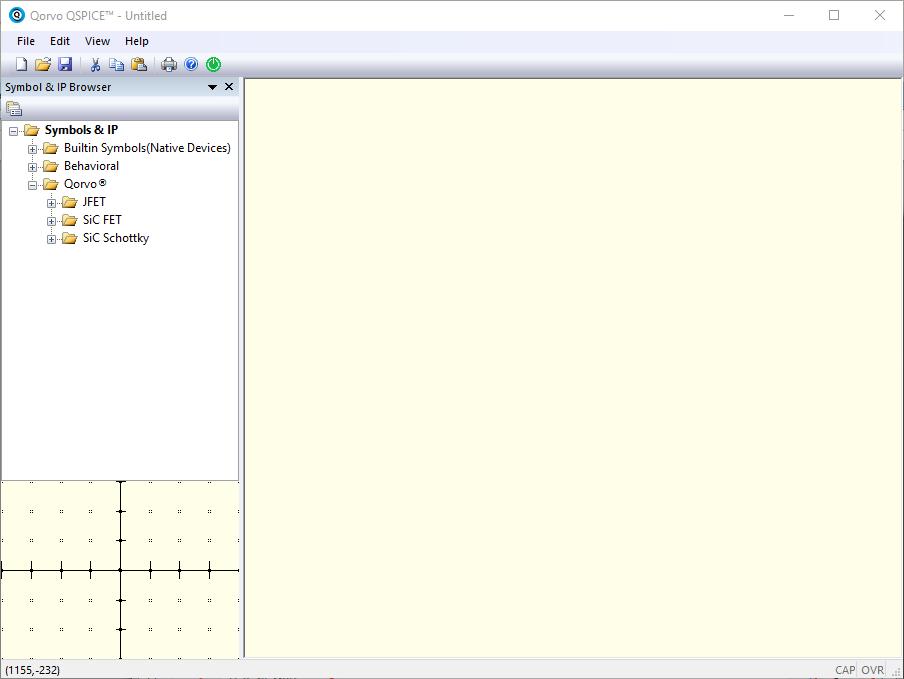
- Launch QSPICE
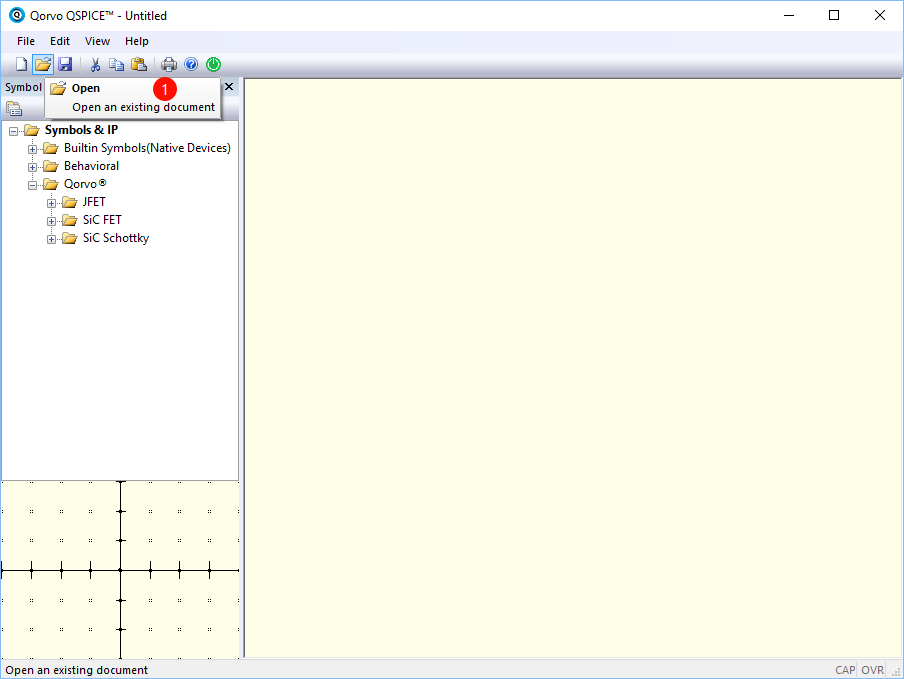
- Open a schematic using the 'open' icon in the toolbar
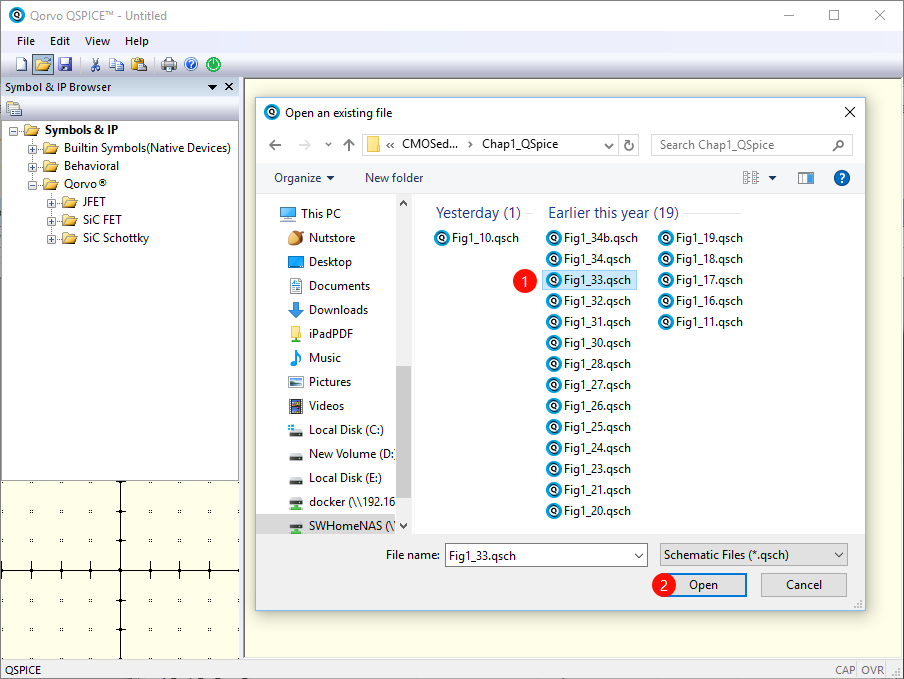
- Navigate to the Qspice model folder extracted from Qspice_CMOSedu.zip
- Select a schematic corresponding to a book figure
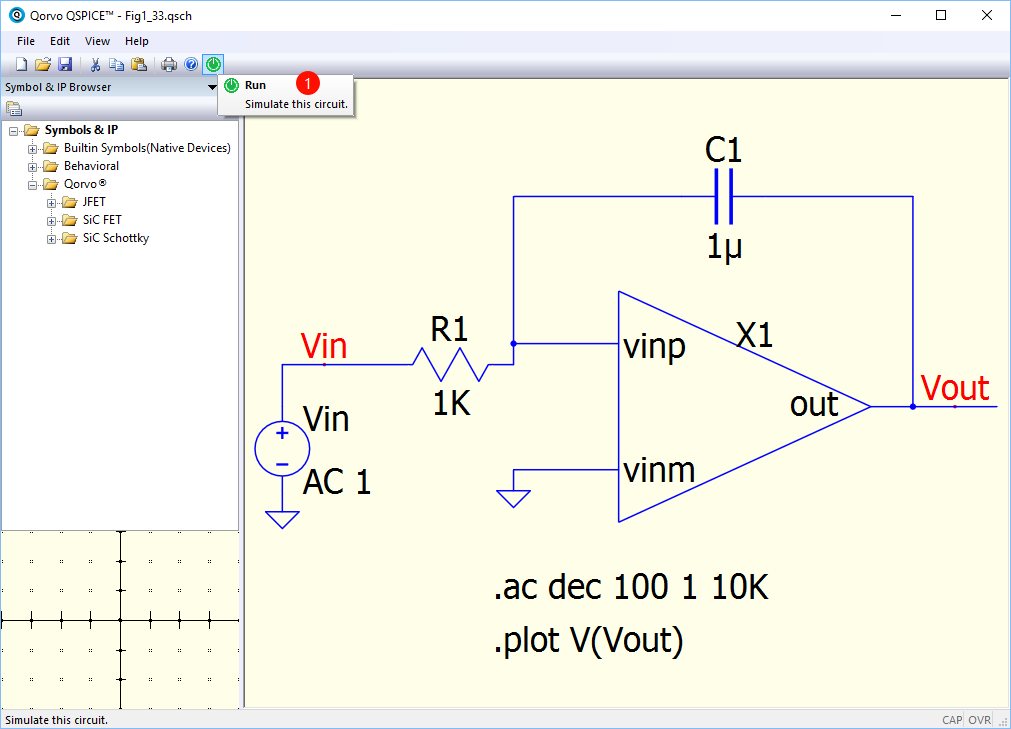
- Run the simulation by clicking the 'Green' icon in the toolbar menu
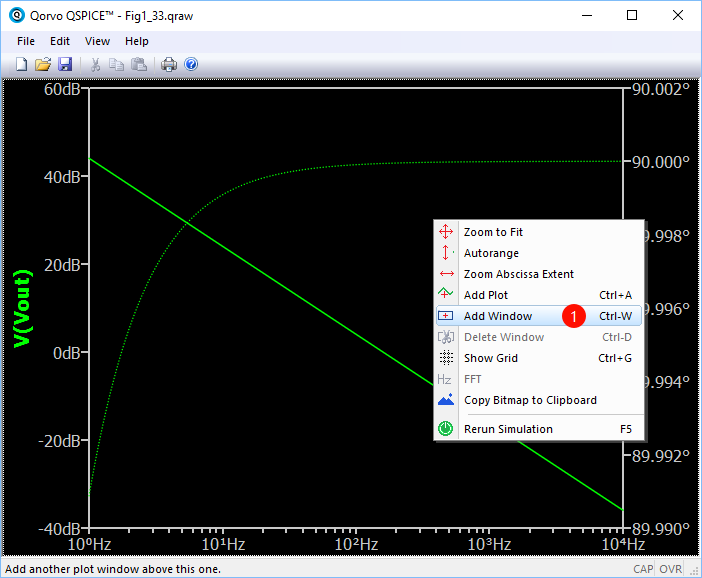
- The simulation results will automatically plot in another Qspice window
- To display some other signals, voltage or current:
1. make sure the '.save all' spice code is used in the schematic;
2. Right click the plot panel and select 'Add Window' to create a new panel;
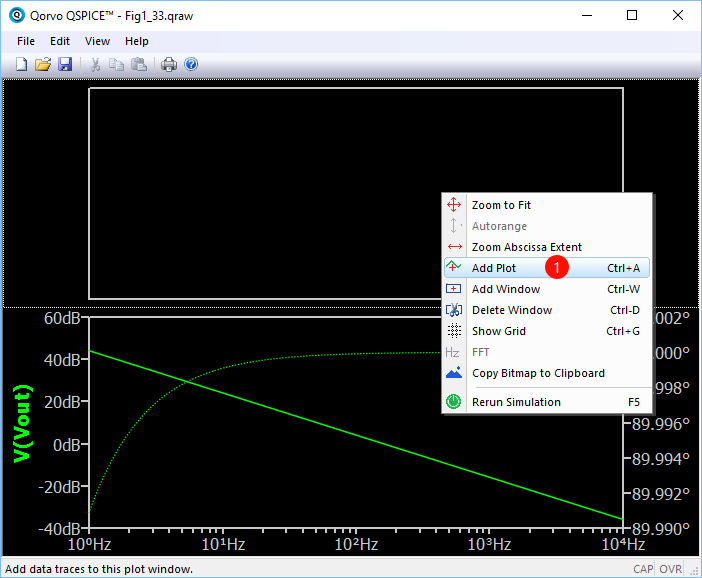
3. Right click the new panel and select 'Add Plot' in the new panel;
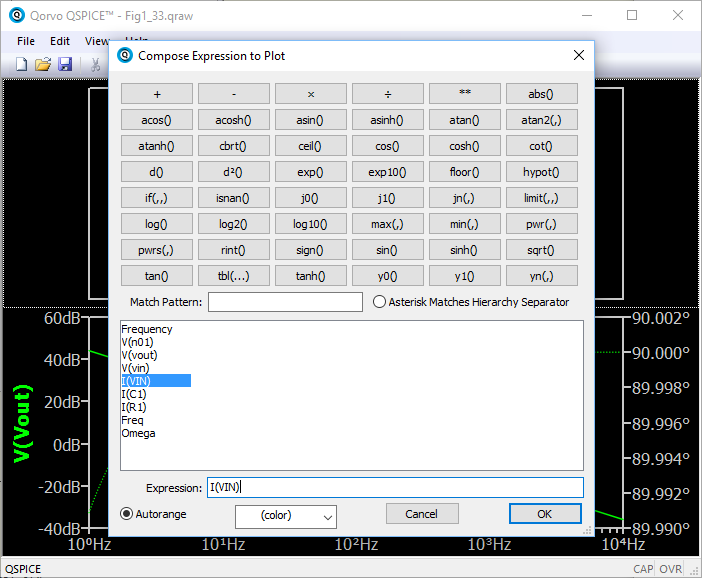
4. Pick the voltage or current you like to plot and then click 'OK'. (On the top of 'Compose Expression to Plot', many math functions can be used)
---
> Launch QSPICE
---
> Open a new QSPICE schematic
---
> Select the textbook circuit model
---
> Run the simulation
---
> Plot simulation results and Create a new window panel in the plot (Right click the current plot panel)
---
> Add plot in the new panel (Right click the new panel)
---
> Select another signal to plot in new panel and function table listed in the 'New Expression window'
---
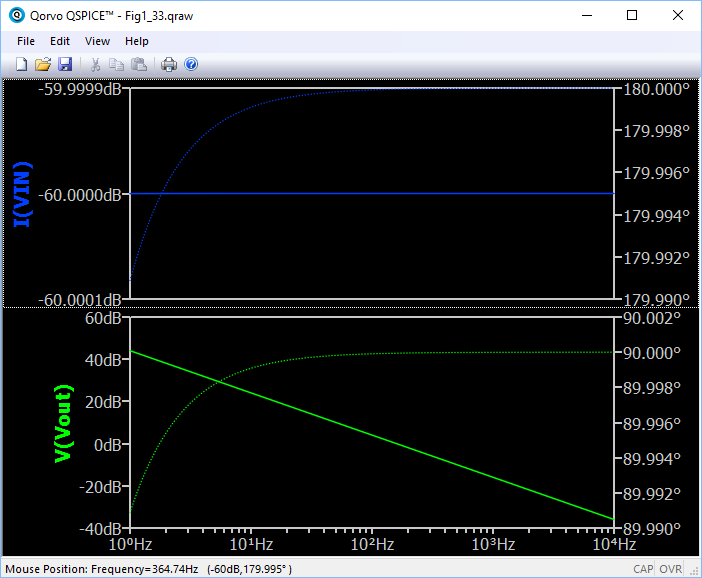
> Final Simulation Result Plot
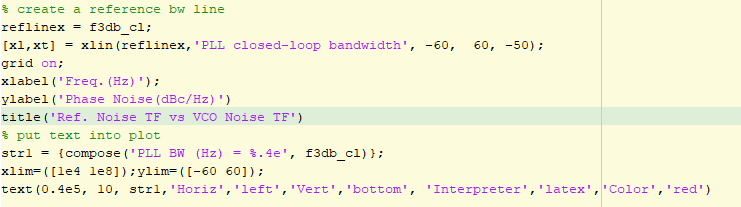
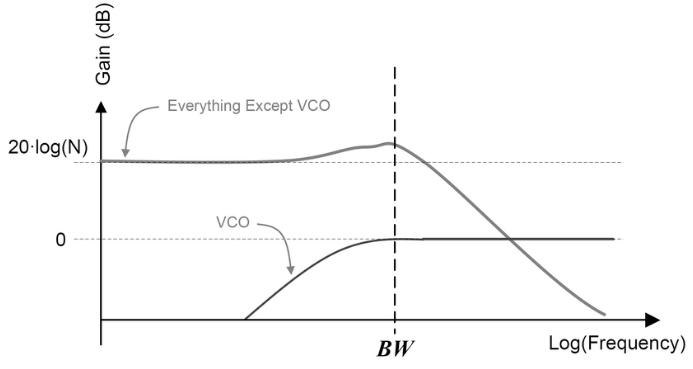 > noise transfer functions of the reference and VCO
Therefore, it is useful to show the PLL bandwidth in the plot.
New version Matlab provides a 'xline' function, vertical line with constant x-value, to plot a line in a plot.
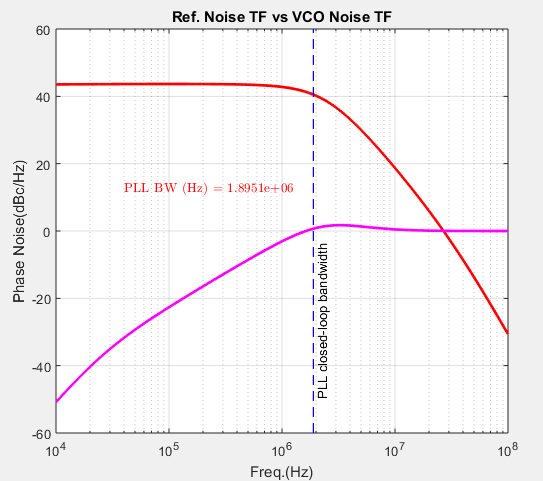
> noise transfer functions of the reference and VCO
Therefore, it is useful to show the PLL bandwidth in the plot.
New version Matlab provides a 'xline' function, vertical line with constant x-value, to plot a line in a plot.
 If you don't have the new version of Matlab, you can use another m function ([Link](https://wwem.lanzouq.com/iSonk1hpecmh)) to add a reference line.
Example code is shown below:
If you don't have the new version of Matlab, you can use another m function ([Link](https://wwem.lanzouq.com/iSonk1hpecmh)) to add a reference line.
Example code is shown below: